This article was published as a part of the Data Science Blogathon
In this article, I am going to explain the steps of how to choose an appropriate algorithm for building a machine learning model for a Data Science Project. If you are new to the Data Science world then you might know or would have encountered this situation a lot of times and you might have wished to find out a way by which you could choose a specific algorithm for a business problem and I am going to explain this process of choosing an appropriate algorithm by taking an algorithmic approach only. So, stay tuned with us till the end of the article to acquire this useful knowledge.
When we look at ML algorithms, then there is no one solution or approach that fits our problem, and choosing a machine learning algorithm you know sometimes becomes a very confusing and daunting task because it depends on a number of factors that are described below:

Image Source: Link
But In this article, we will be discussing the algorithmic approach to pick an appropriate algorithm for building a machine learning model. So, after reading this article you no more have to worry about which algorithm do you need to pick for a particular business problem. You just need to follow the described approach to find the appropriate algorithm.
To follow this article properly, I assume you are familiar with the basics of Machine Learning. If not, I recommend the below popular course given by Analytics Vidhya to get started with the Machine Learning Basics:
There are four families of algorithms on which we will be discussing in this article.
The main diagram which is the core for this article is shown below:

Image Source: Link
We will start from the top right corner where there is an orange start circle.
Some of the notations or representations which you keep in mind to follow the article properly while reading it are as follows:
Here note that blue circles are conditions on the basis of which you know can either select YES or NO. YES is directed by the Green arrow and NO is depicted by the Red arrow.
There are orange arrows as well which depict a particular entity as either not working or the result is not defined.
Here the green rectangular boxes are nothing but individual algorithms in a specific category of algorithms.
Now, Let’s start our discussion with the left-hand side of the start button shown in the diagram:
If the number of sample or records or observations are less than 50, then there is a need to extract some more data either from a Relational Database or Flat files or from NO SQL Database. On the other hand, if the number of samples or records or observations is greater than 50, then we will check if we are predicting the categories such as,
If the answer is YES, then we will move on to check if the data is labelled or not which means whether we have a target or dependent variable present or not in our dataset. If the answer to this is YES, then it means that it’s a classification problem.
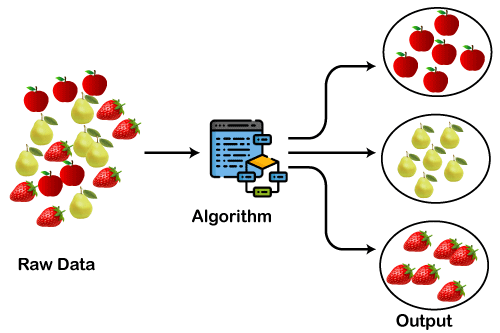
Figure Showing how Classification Algorithms work
Image Source: Link
Now, we need to check if the number of observations or samples, or records in a dataset is less than 100,000. If the answer is YES, then it means that we can go for linear SVC i.e, Support Vector Classifier algorithm. If somehow linear SVC doesn’t give the right results or accuracy then we will check if the data is in the text format or not.
If the dataset is in the text format, then we should go for the Naive Bayes algorithm for classification purposes since this algorithm is used for classifying sentiments of users to perform Sentiment Analysis and it is just once the application of sentiment analysis.
On the other hand, if the data is non-textual in nature, then we should opt for the KNN i.e, K Nearest Neighbor classifier. If somehow the KNN algorithm doesn’t work or gives the right results or accuracy, then we should try to build the model using either SVC i.e, Support Vector Classifier or Ensemble Classifier. Now coming back to the number of samples or observations. If the number of samples in the dataset is greater than 100,000 then we should pick SGD i.e, Stochastic Gradient Descent Classifier.
If somehow this classifier doesn’t work or gives the right results or accuracy, then we should go for the kernel approximation classifier. This actually pretty much covers the classification family of algorithms.

Figure Showing how Clustering Algorithms work
Image Source: Link
Now, coming back to the condition where we were checking if the data is labeled data or not let’s say we don’t have a labeled data i.e, no target or dependent variable available in the dataset then we will fall into the clustering family of algorithms where we will check another condition to understand if the number of categories is known to us or not.
If the number of categories is known, then we will check if the number of samples or observations is less than 10,000 in a dataset. If the answer to this is YES, then we should go for the K-means algorithm, and if somehow if the k-means algorithm gives a bad accuracy or results, then we should either go for Spectral Clustering or GMM i.e, Gaussian Mixture Model clustering.
Now, coming back to the number of observations or samples. If the number of samples in a dataset is not less than 10,000 then we should go for mini-batch k-means clustering for our business problem.
Now, let’s go one step back to check if the number of categories is known. If in this case, the answer is NO i.e, we don’t know the number of defined categories for our business problem, then we will check if the number of samples or observations in a given dataset. If the number of observations is less than 10,000, then we should go for algorithms like Mean Shift or VBGMM i.e, Variational Bayesian Gaussian Mixture model. On the other hand, if the number of observations is not less than 10,000, then it’s pretty difficult to define a model for a business problem statement.

Figure showing how Linear Regression Algorithm work (Regression Family)
Image Source: Link
Now, let’s step back a bit further where we checking if we were predicting a category or not so here if in case we are not predicting a category, then we will move to check if there is a requirement to predict a quantity or not.
If we are predicting a quantity then we will fall into a regression family of algorithms. Here firstly we will try to find out if a dataset has less than 100,000 samples or observations.
If the number of samples in a dataset is greater than 100,000, then we will choose SGD i.e, Stochastic Gradient Descent Regressor. Otherwise, we will check one more condition to decide if few features should be important from a prediction point of view.
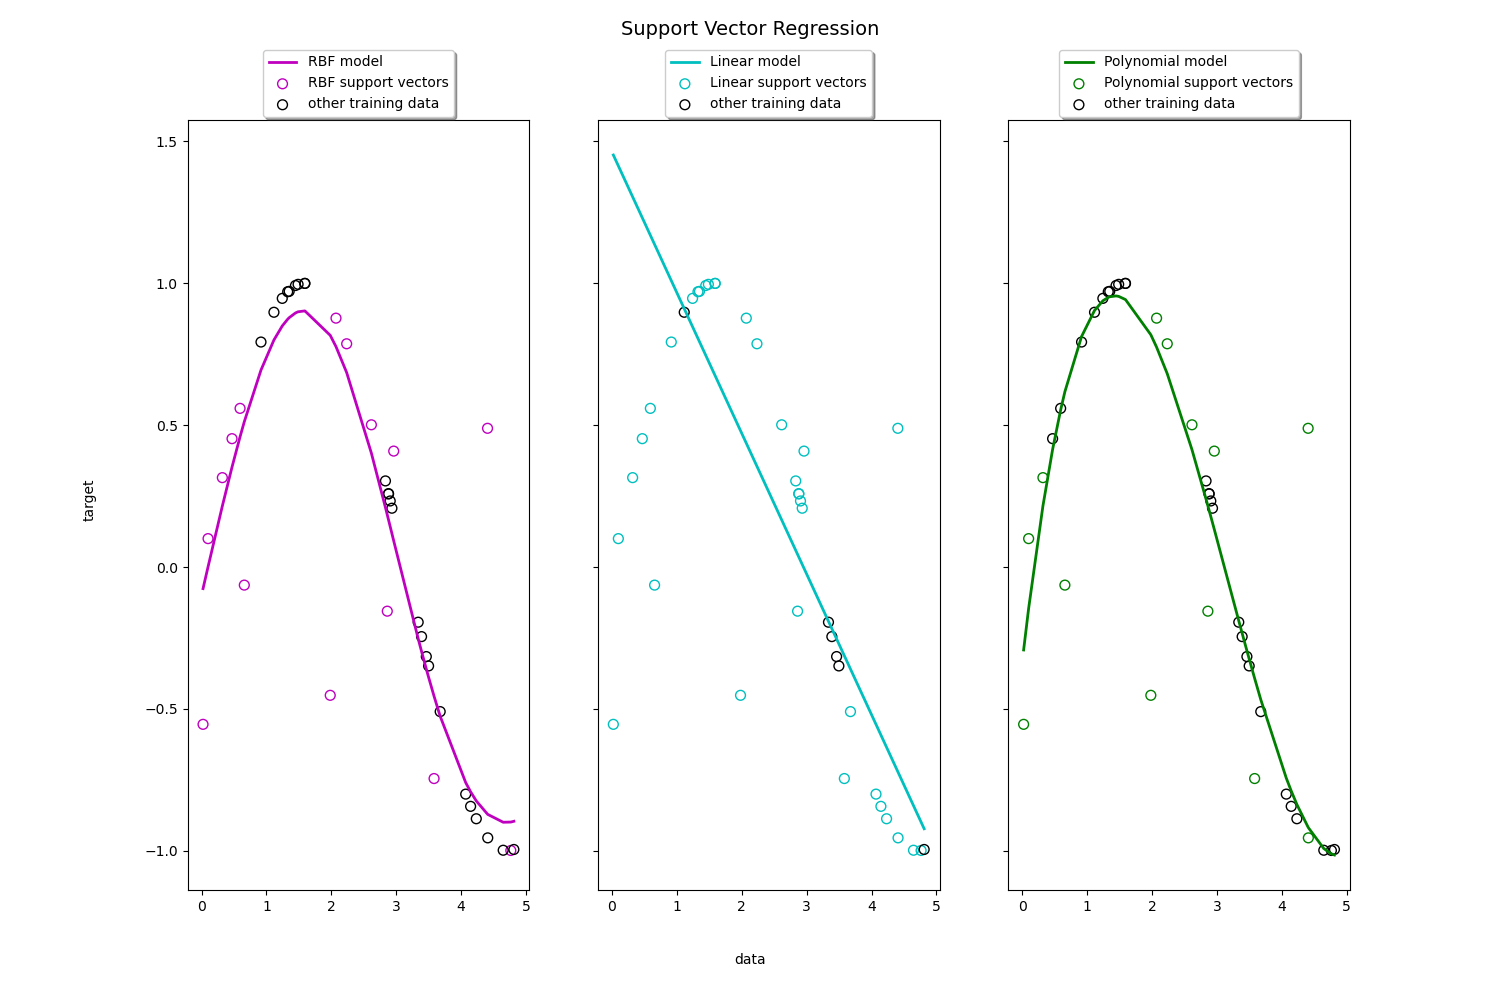
If that is true, then we would choose algorithms like Lasso or ElasticNet regression otherwise we would pick algorithms like Ridge regression or SVR i.e, Support Vector Regressor with kernel defined as linear i.e, the graph will be a straight line in this case(described below).

Image Source: Link
So, moving on let’s say in neither Ridge regression nor SVR with the linear kernel is working or not giving the right accuracy, then we can go for again SVR but this time, the kernel would be RBF i.e, Radial Basis Function which is also a default kernel i.e, the graph will be curvilinear in nature as you can see in left of the above picture. Here we can also try for fitting a model on an ensemble regressor or an ensemble regression algorithm.

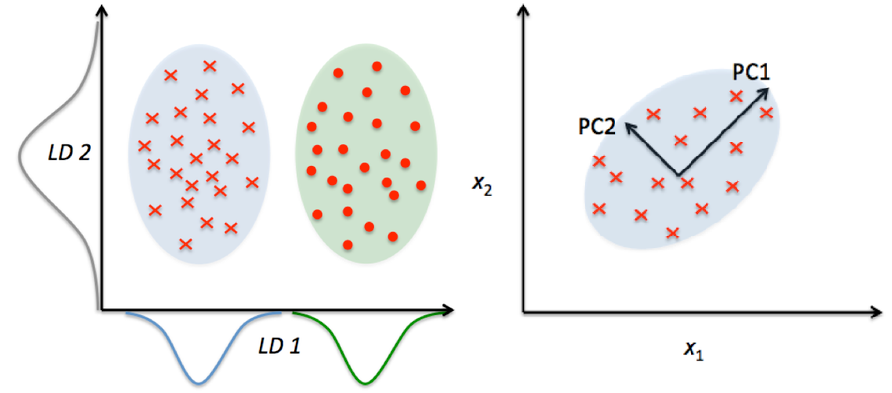
Figure showing how LDA and PCA works(Dimensionality Reduction Family)
Image Source: Link
Now, step back one step back once again to a condition where we were checking a condition of whether we have a requirement of predicting a quantity or not. So, If your requirement was not to predict a quantity rather you just wanted to take a look at features or independent variables such that you wanted to shortlist the independent variables having maximum variability maybe thousands of columns of your dataset, so that means we are falling into dimensionality reduction family of algorithms.
Now, we know as we know that it’s not possible to build a model with thousands of columns or variables in a dataset, so we try to find the limited number of independent variables or columns or features to generate predictions and hence we use algorithms in this category to solve this purpose. This means we are trying to perform some kind of dimensionality reduction i.e, reducing the number of variables that can actually provide the still gives you comparable accuracy when it comes to building prediction models.
Now, we pick randomized PCA i.e, Principal Component Analysis here. If this algorithm is not giving the right results, then you can move forward to check the number of samples is less than 10,000 or not. If not, then we can pick or choose a kernel approximation algorithm otherwise we can either go for Isomap or Spectral Embedding. If neither of these algorithms works then we can pick LLE i.e, Local linear embedding algorithm.
So, now let’s step back to the condition where we were checking the condition of just taking a look at features. If the answer to this is NO here, then we can assume that we have a hard time or tough luck for choosing an algorithm for our business problem statement.
So, Guys in this article, I clearly explained how to choose an appropriate algorithm efficiently for the given business problem statement so that you don’t have to look around here and there.
You can also check my previous blog posts.
Previous Data Science Blog posts.
Here is my Linkedin profile in case you want to connect with me. I’ll be happy to be connected with you.
For any queries, you can mail me on Gmail.
Thanks for reading!
I hope that you have enjoyed the article. If you like it, share it with your friends also. Something not mentioned or want to share your thoughts? Feel free to comment below And I’ll get back to you. 😉
Lorem ipsum dolor sit amet, consectetur adipiscing elit,