Are you a person who spent hours or even days tinkering with the process of finding the best pipelines and parameters during machine learning modeling? If you are still trying to discover pick of the bunch, then this article is for you.
Most of the time, machine learning engineers have to go through the necessary process of modeling where they need to find an optimal algorithm and have to tune it using hyperparameters. Many folks may say: “The juice is worth the squeeze” and it is dogged that does it. But, it is a daunting task and a tough row to hoe!
The most general approach in the optimization process of hyperparameter — Grid search is doing a kind of brute force search for identifying the set of parameters that make the best model fit. Recent studies show that random evaluation of those parameters within the grid search can find the best ones. Yes, you already heard that “Even a blind squirrel finds a nut once in a while” somewhere else. This scenario underlines the inevitability of intelligent searching in the domain of hyperparameters.
So let’s cut to the chase. Here comes the need for a Data Science Assistant — I am not talking about a human but an Automated Machine Learning (AutoML) tool. Many AutoML tools aid in speed-up Machine Learning by identifying the best models, but even so, I am buzzing about one of the first AutoML packages — Tree-based Pipeline Optimization Tool (TPOT). This super cool intelligent tool is an open-source Python package that can go through many possible pipelines (even a thousand different possibilities) to automate the most mind-numbing process of machine learning — Identifying the best of the bunch for your data.

credits:https://dl.acm.org/doi/10.1145/2908812.290891
This AutoML tool is an unbeatable asset and is a real bargain if if you want to get a classification accuracy which is very competitive. Over and above that, this tool can identify artificial feature constructors that can enhance the classification accuracy in very demanding way by identifying novel pipeline operators. The operators of TPOT are chained together to develop a series of operations acting on the given dataset, as represented in below figure.
.png)
Tree-based pipeline from TPOT: credits: http://automl.info/tpot/
There is a case study here, which predicts the prevalence of diabetes within 5 years using the Pima Indians Diabetes dataset. According to this study, the authors state that the maximum accuracy achieved in this problem is 77.47%.
Let’s do the automated machine learning in this same scenario and see how it works using TPOT AutoML.
For the demonstration purpose, I am using the same diabetes dataset. If you wish you can try other problems solved by this open-source Python package in official GitHub repository of TPOT developers.
# import the AutoMLpackage after installing tpot.
import tpot
# import other necessary packages.
from pandas import read_csv
from sklearn.preprocessing import LabelEncoder
from sklearn.model_selection import StratifiedKFold
from tpot import TPOTClassifier
import os
#load the data from local file into a dataframe
file_path = './pima-indians-diabetes.data.csv'
#copy data to dataframe
df = pd.read_csv(file_path,header=None) #REPLACE with your own dataset .csv filename
df.dtypes
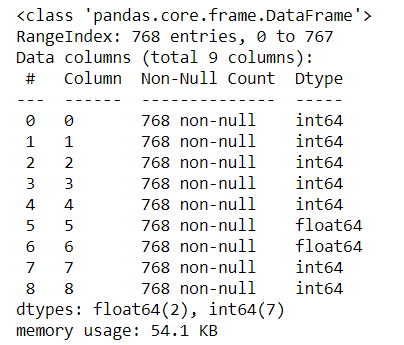
df.info()
The dataframe information is as represented in below screenshot:

# display dataframe
df
The preview of dataframe is as depicted in below screenshot:

# splitting values of dataframe into input and output features
data = df.values
X, y = data[:, :-1], data[:, -1]
print(X.shape, y.shape)
#(768, 8) (768,)
X = X.astype('float32')
y = LabelEncoder().fit_transform(y.astype('str'))
# model evaluation definition, 10 fold StratifiedKFold used here
cv = StratifiedKFold(n_splits=10)
# define TPOTClassifier
model = TPOTClassifier(generations=5, population_size=50, cv=cv, scoring='accuracy', verbosity=2, random_state=1, n_jobs=-1)
# performing the search for best fit
model.fit(X, y)
# exporting best model
model.export('tpot_data.py')

Screenshot: Best pipe line selection when cv=10
I also repeated the above experiment with cv=5.
# model evaluation definition, 5fold StratifiedKFold used here
cv = StratifiedKFold(n_splits=5)
# define TPOTClassifier
model = TPOTClassifier(generations=5, population_size=50, cv=cv, scoring='accuracy', verbosity=2, random_state=1, n_jobs=-1)
# performing the search for best fit
model.fit(X, y)
# exporting best model
model.export('tpot_data.py')

The best pipeline chosen while using 10 fold cross validation is:
LinearSVC(input_matrix, C=5.0, dual=False, loss=squared_hinge, penalty=l1, tol=0.01)

Accuracy : 77.47%
The best pipeline chosen while using 5 fold cross validation is:
XGBClassifier(ExtraTreesClassifier(input_matrix, bootstrap=True, criterion=entropy, max_features=0.55, min_samples_leaf=1, min_samples_split=2, n_estimators=100), learning_rate=0.001, max_depth=10, min_child_weight=13, n_estimators=100, n_jobs=1, subsample=0.9000000000000001, verbosity=0)

Accuracy : 78.39%
We just tried Default TPOT for the above classification problem and it utilizing only the default configuration. There are many built-in configurations for the AutoML TPOT. These variations are listed below:
The magic of TPOT is advanced from a version of genetic programming in the scenario of supervised learning. Even though I call it a kind of “magic” it cannot supplant machine learning engineers nor data science experts. This tool traverses through the data and identifies the best features. Moreover, it recommends pipelines too. The user has the privilege of exporting these pipelines and amalgamate their domain knowledge as they visualize the fit.
So if you have a machine learning project where you struggling to find a suitable model, then TPOT is your cup of tea, let’s give it a try. I have a strong hope that your efforts will bear fruit and no need to squeeze your machine learning model again. 🙂
Lorem ipsum dolor sit amet, consectetur adipiscing elit,